fbpx

Published July 10, 2025 . 0 min read

Understanding S-Curves in Construction Project Forecasting

Construction projects are complex, with many moving parts and competing priorities. One of the simplest and most effective tools for monitoring progress and staying on top of cost and schedule performance is the S-curve.

In this article, we’ll break down what an S-curve is, how it works in construction forecasting, and how tools like ProNovos make it easier to apply this concept in the real world.

What is an S-Curve?

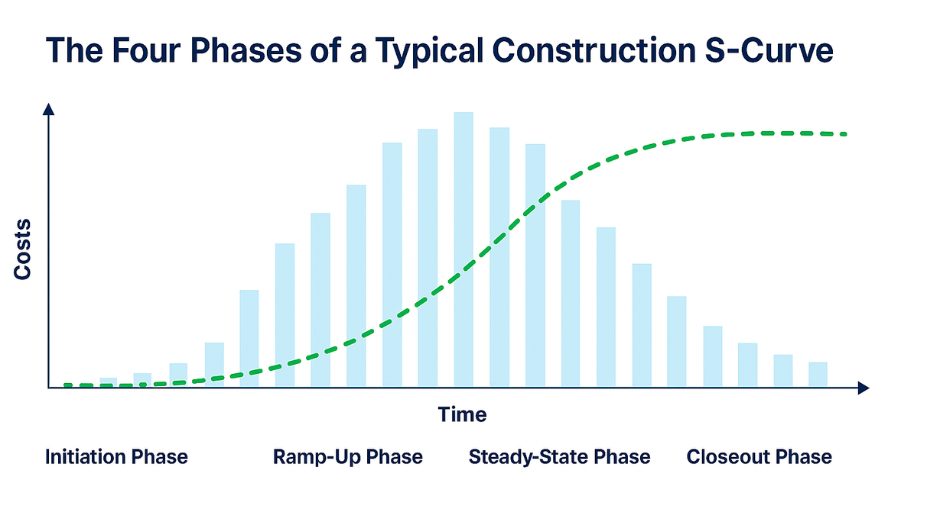
An S-curve is a visual tool used in construction project management to track cumulative progress, typically cost, work completed, or earned value, over time. Named for its distinctive “S” shape, the curve reflects the natural flow of a project: slow and flat during initial setup and mobilization, sharply rising during the most active construction phases, and then flattening again as the project wraps up. S-curves help project managers easily compare planned vs. actual performance, revealing trends, delays, or budget overruns in a clear, intuitive format. Whether you’re monitoring financials or productivity, S-curves bring simplicity and clarity to complex project data and help teams make more informed decisions.

Why Use S-Curves in Construction?

S-Curves help answer critical questions like:

• Are we on schedule?

• Are we over- or under-spending?

• Is our actual progress aligning with our estimates?

By comparing planned progress (your baseline) with actual results, S-curves make it easy to detect early signs of delay, overrun, or inefficiency, giving teams a chance to course-correct before bigger issues arise.

1. Initiation Phase (Flat):

The curve starts flat. Work is minimal as the site is being prepared and resources are mobilized.

2. Ramp-Up Phase (Steep Climb):

As construction gets underway, activity levels spike. This is where you see rapid progress and spending.

3. Steady-State Phase (Leveling Out):

The project finds a rhythm. Progress continues at a steady and predictable rate.

4. Closeout Phase (Flat Again):

 Work winds down. Remaining tasks are completed, and spending tapers off.

Understanding where you are on this curve provides the context to make more informed decisions about forecasting and resource allocation.

Key Types of S-Curves in Construction

There isn’t just one kind of S-curve. Here are a few that project teams often use:

Planned vs Actual Progress Curve

Visualizes what was supposed to happen versus what occurred.

Budget Cost Curve

Forecasts when money will be spent across the project timeline.

Actual Cost Curve

Tracks real expenses against the plan to monitor budget health.

Earned Value Curve

Integrates cost and schedule to show the value of work performed.

These S-curves help construction teams connect the dots between time, cost, and performance, an essential skill for managing projects proactively.

How to Build and Use an S-Curve

You don’t need to be a data analyst to use S-curves effectively. Here’s a simplified process:

1. Start with Your Baseline:

Use your schedule and budget to define what progress should look like over time.

2. Collect Real-Time Data:

Pull actual hours, dollars, or units completed into your ERP or field systems.

3. Plot the Curve

Visualize planned progress vs. actual progress.

4. Analyze the Curves:

Where is the actual curve ahead or behind the plan? What might be causing the difference?

5. Take Action:

Use the insights to shift resources, reforecast cash flow, or flag concerns to stakeholders.

Whether you’re reviewing a monthly project status or planning for the next quarter, ProNovos helps you see the story your data is telling, without digging through spreadsheets.

Real-World Use Case

Here are a few examples of how S-Curves play out in construction:

Early Progress, Late Problems:

A project starts fast but flattens out too soon. The S-curve indicates that momentum is slowing, and corrective action is necessary to prevent delay.

Delayed Start, Fast Catch-Up:

The actual progress line starts below the plan but then accelerates past it. This could mean the team is working overtime or relying on more resources than budgeted.

Front-Loaded Costs:

A sharp rise in actual cost early on might suggest early procurement or billing. Use the S-curve to forecast cash flow needs.

Back-Loaded Work:

A slow initial curve followed by a steep late climb might signal poor scheduling or tight deadlines during closeout.

Final Thoughts: A Visual Tool for Smarter Forecasting

S-curves are more than just charts; they’re a practical way to track progress, identify risks, and make smarter decisions throughout a project’s lifecycle.

They’re also a powerful tool for educating Project Managers on the financial side of construction, especially when it comes to understanding how progress ties to cash flow. With the right visuals, PMs can see where the money is going, when it’s coming in, and how their decisions impact the bottom line.

By combining S-curve models with the automation and visualization tools in ProNovos, construction teams can forecast more accurately, control costs more effectively, improve communication across departments, and stay on track to deliver successful projects.

Ready to bring S-curve forecasting into your workflow and help your PMs build financial intelligence? Schedule a demo to see how ProNovos makes it easy.