My job consists of educating and helping construction companies do two things, 1). better understand the value of data and 2). help their organization embrace analytics. If you would have asked me how things were going four years ago, you probably would have heard a less optimistic point of view. It’s true, four years ago I questioned myself many times about whether or not I made the right decision by starting a construction analytics software company. Many companies were so content with printing out these long reports, perfectly placing a ruler on each job line and highlighting issues.
I witnessed project managers operating in the field with week-old cost data and executives not getting updated information on projects for 30 days or more.
These companies were content because they’ve been doing it that way for a long time. This was their SOP.
Even though the word “change” and construction goes together like oil and water, I knew that it would only be a matter of time before the industry catches on. When you consider the amount of data we’ve been generating, the variety of data and the velocity, we will either rise to the opportunity or drown in an ocean of data.
I’m not talking in general terms, I’m speaking specifically to the construction industry. Think about how many new field applications exist now compared to two years ago. How about the data that is produced from drones and BIM? Not to mention regulations that are forcing us to capture data that wasn’t required years ago. And you want to manage this in Excel or a “custom report” because that’s how it has always been done?
Where are we now in terms of embracing “change”? Well, over the past four years, I’ve spoken with at least 1,500 construction companies of all trades and sizes. I’ve gathered enough data to see a data trend/continuum and it goes like this…
- ERPs – Custom reports are generated from their ERP (accounting, PM, service module, etc.). These custom reports answer specific questions, but they are too narrowly focused and before you know it, you have more questions than you have answers and then you move on to the next bullet point.
- Excel or MS Access – Before I beat up on Excel, let me first say that it is a powerful tool that can serve many purposes very well. However, any company that is using Excel as their enterprise reporting tool is doing their organization a disservice, if you know about BI and analytical software. That last statement might offend a few people and we all have a right to our own opinions. However, I make that statement coming from a place of concern. Again, consider data volume, velocity and variety. Getting back to my observation, most companies understand the pain associated with using Excel or MS Access as a reporting tool, so they move on to the next step…
- Traditional Reporting and BI – Microsoft BI (Power BI, Reporting Services, Analysis Services, etc.) and many vendor ERP BI applications fall into this category. At this point, construction companies are realizing the value of information. They begin assembling a small committee to review off-the-shelf BI tools in the market place. Some companies might be fortunate enough to have their own developers build something for them, which is expensive and probably not the best way to use your resources. Having your own data/business analyst would be a much better way to go (this deserves its own article). However, when you consider the three Vs (volume, velocity and variety) these solutions are still in the Traditional Reporting and BI phase. Most industries embraced this phase 10 years ago and moved on to more advanced stuff. That brings me to the next step…
- Data Exploration and Visualization – So now you’ve built custom reports from your ERP, you’ve dumped data into Excel and spent countless of hours in spreadsheet hell and then you graduated to a “standard dash-boarding” tool. But then the president asks you a question that can’t easily be answered from your standard dashboard because it is pre-configured to only answer known questions. What do you do? You’ve just invested in this new dashboard application, received lots of praise for moving the company out of the dark ages, but now what? Most companies either fall back to step 2 (Excel or Access) or they look for another tool that allows them to explore the data. Tools like Tableau, Domo are great for visualizing data and being interactive with your data. However, now you have to figure out how to get Vista, Sage, Procore, Coins, Spectrum, etc. to work with it. You will be constantly wondering which KPIs you should be focused on and how to get the rest of the organization to adopt it.
The image below depicts the journey most companies find themselves on. Each step of the way, they begin to see a correlation between the value of the data and the competitive advantage they are gaining in the industry.
However, there’s a plateau that they will soon face because of the three V’s (volume, velocity & variety). Unfortunately, a traditional BI system will not help with this. And this brings me to the difference between Business Intelligence and a Construction Analytics Platform.
Business Intelligence (BI) falls under the umbrella of Analytics. BI is needed to operate the business, but Construction Analytics is needed to change the business.
BI is more about looking in the rearview mirror and using historical data from one day to many years ago. Construction Analytics is looking in front of you to see what’s going to happen.
This will help you be proactive, anticipating what’s coming, while BI tells you what has happened. An example is a Job Summary report. This tells you which jobs went over budget last month. However, analytics will tell you which open jobs are most likely to run over budget.
So, what does a Construction Analytics Platform look like? I’ve done our homework and after speaking with 1,500 construction companies this is what is needed:
- Advanced Analytics – This includes predictive and prescriptive. There’s so much to say about this that it requires it’s own article. However, using the example from about, it will tell you which open jobs are most likely to run over budget.
- Data Source Agnostic – No matter where your data lives, it should be accessible via your Analytics platform. So if you decide to switch from one system to another or add on a cloud-based system, your Analytics platform should have the ability to consume that data and give you a continuous flow of information.
- Preconfigured Data Model – No matter how much the industry changes, we will always have jobs (projects), cost codes (phase codes), customers, vendors, etc. This model makes deployment fast and easy. The days of an analytics project taking months to complete should be behind us. Also, it is already loaded with industry standard KPIs and should be built on best practices.
- Self-Service – The latest trend is not just about generating reports, but about letting people get in the flow of analysis, explore their data, and ask their own questions. This has completely changed the way many companies approach business intelligence.
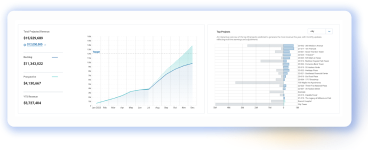
- Advance Visualizations – The days of rows and columns of data are behind us. One picture is worth a million Excel cells. Visualizations help us understand the patterns, trends and correlations that go undetected in text-based data.
- Intelligent Data Entry – This doesn’t fall under a typical Analytics umbrella, but for the construction industry, this is needed. 99% of companies still track something in Excel that doesn’t gracefully fit into their ERP. Or, they are wanting to do some what-if scenarios and capture the results for later analysis. When the data is entered directly into the platform, it immediately lends itself to the connected-ness of the big picture.
Below is the complete Data Intelligence Maturity Continuum.
Don’t forget to check out our other articles here…
Construction and data is my passion. If you’re a construction company, construction consultant or a data enthusiast and you’d like to chat, I’m easy to reach. www.pronovos.com.
About the author:
Bruce Orr is the Chief Data Scientist at Pronovos Construction Analytics. Pronovos provides affordable analytical solutions for contracting firms that utilize ERP software from Sage, Viewpoint, Procore, Foundation, SAP, Jonas, Accubuild and many others.