Construction Analytics and Financial Workflows

Parallel Paths
to Higher Performance

The following eBook describes the parallel paths to achieving greater efficiency and stronger profit margins through utilizing financial workflows and real-time dashboards. 

What you will find in the eBook:

  • An in-depth look into the benefits of financial workflows and real-time construction analytics dashboards
  • How to use data-driven insights to educate project managers, superintendents, and others who are responsible for projects and budgets
  • Common metrics and KPIs in construction that revolve around financial performance, from the company down to project level
  • How to use automated data flow to eliminate headaches with manual data entry, excel & spreadsheet overload, and working out of multiple systems
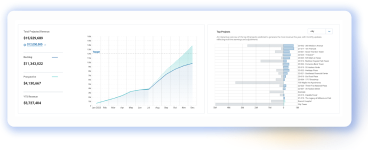
“Companies can effectively leverage data and analysis to get to the truly ‘useful’ information that correlates with their key pain points (e.g., margin gains/fades, labor productivity, employee turnover, rising costs of doing business, etc.). To be most effective, data analytics must be married with a visual analytics dashboard that a broad range of users can access, review and make decisions on in real-time.”

FMI

Get it sent to your inbox

Parallel Paths to Higher Performance

The following eBook describes the parallel paths to achieving greater efficiency and stronger profit margins through utilizing financial workflows and real-time dashboards. 

What you will find in the eBook:

  • An in-depth look into the benefits of financial workflows and real-time construction analytics dashboards
  • How to use data-driven insights to educate project managers, superintendents, and others who are responsible for projects and budgets
  • Common metrics and KPIs in construction that revolve around financial performance, from the company down to project level
  • How to use automated data flow to eliminate headaches with manual data entry, excel & spreadsheet overload, and working out of multiple systems

“Companies can effectively leverage data and analysis to get to the truly ‘useful’ information that correlates with their key pain points (e.g., margin gains/fades, labor productivity, employee turnover, rising costs of doing business, etc.). To be most effective, data analytics must be married with a visual analytics dashboard that a broad range of users can access, review and make decisions on in real-time.”

FMI

Get it sent to your inbox