
RECORDING AVAILABLE HERE:
https://pronovos.com/webinar-using-analytics-to-navigate-economic-uncertainty/
MODERATOR:
Eric D. Vittardi, Market Development Manager at Foundation Software, a leading provider of job-cost accounting and construction management software solutions.
PANELISTS:
- John Killingsworth, PhD, a construction management professor at Colorado State University who has conducted extensive research on how contractors can weather economic downturns;
- Bruce Orr, Founder of ProNovos and a 20-year veteran of data analytics;
- Bryce R. Wisan, CPA, CCIFP, a Partner at CPA firm Eide Bailly, where he is executive committee member of the firm’s Construction & Real Estate practice—recently named the #10 construction accounting firm by Construction Executive magazine; and
- Wickham “Wick” Zimmerman, Chief Executive Officer and Co-Founder of Anaheim, California-based OTL, a design-build contracting firm known for its rockwork, themed construction and specialty water feature projects.
VITTARDI: Contractors are having to make some tough decisions at this time, and generally the best decisions are informed decisions. That dovetails with analytics in a lot of ways. What does analytics mean to you?
WISAN: Analytics is a process of cleansing, integrating, transforming and modeling data in order to discover useful information to inform conclusions and to support decision-making.
Today we have more data from more sources than we have ever had before. In fact, some people estimate that more data has been created in the last two years than in all of previous recorded history.
So analytics uses data extraction and warehousing systems and then various statistical algorithms and visual tools to really help us harness the data and make better business decisions.
In the construction industry, we lag some of the other industries in terms of data analytics adoption and usage, but that gives us the benefit of being able to leverage lessons learned in other industries. My personal belief is that the winners in the next stage of business will be those that effectively use data to help them optimize their business operations.
ZIMMERMAN: I think of analytics more as a method of examining and analyzing data that helps me reach a conclusion. So the goal for me is to gain new insights that will help me improve my business.
[VITTARDI ASKS FOR DESCRIPTION OF FOUR BASIC PRINCIPLES OF ANALYTICS]
ZIMMERMAN: The most basic form is descriptive analytics. It uses simple statistics to answer the basic ‘what’ in decision-making. We all do this in calculating our financial ratios and other performance indicators such as average days in accounts receivable, return on equity and things of that sort.
KILLINGSWORTH: I will take diagnostics. When we look beyond those basic descriptive analytics, we start looking at diagnostics, which uses statistics to consider relationships between variables or essentially the ‘why’ of decision-making. So, for example, why are certain projects consistently more profitable than others? Or why are we having scheduling trouble with this particular project? We use the diagnostics to determine what variables produce the best results.
Where those relationships exist, which variables are influencing outcomes? And so diagnostics is ultimately about leading to more informed managerial decisions.
WISAN: And following diagnostics comes predictive analytics. Predictive analytics consists of studying historical data in order to identify patterns and correlations, to help predict future trends and outcomes.
A practical example of this is that Amazon and Apple, for instance, are very good, almost scarily good, at analyzing my purchase history and suggesting new books and music that I might enjoy. So what does this mean in construction? It means that we can use data to help predict what jobs will actually cost to complete; how project teams are likely to perform; whether subcontract bids are reasonable, and other things like that.
Really, ‘how is this likely to turn out?’ is really the question that predictive analytics answers. It can also be used to model cash flows and working capital.
ORR: So I will jump in and take the last one. And that is prescriptive analytics. It is actually one of my favorites. It works with predictive, which involves as Bryce just said statistics and modeling; however, where predictive analytics will give you an estimation of what is likely to happen, prescriptive analytics will recommend or prescribe a course of action.
Not to get too nerdy here, but it uses advanced computational algorithms that we can understand to really look at multivariable relationships.
Really, it is prescribing a course of action. So let me give you an example. Let’s say you are the CEO of a construction firm and your goal is to maximize your resources and profit by building a simple model that includes past job performance by market, by type size and a few other factors. You can theoretically automate the go or no-go process when considering new work to pursue.
Now this would ensure that your business development team isn’t wasting its time and the company is not taking on unnecessary risks.
I would just like to add this: This area is very uncomfortable territory for most construction managers. So the practical application of prescriptive analytics hasn’t taken a stronghold in our industry, but I think in the future we might see that changing.
VITTARDI: What question should contractors be asking themselves, especially right now?
WISAN: Honestly, I think this is the most challenging aspect of analytics, figuring out what the right questions to ask are. Because once you start digging into issues, what may have seemed clear and obvious at the outset often becomes far less so.
In the current environment, contractors are asking questions about how or if they need to right-size their operations to fit their market environment. Their key concerns revolve around cash flow and how to adjust their labor and equipment, if at all, in order to cash-flow their business.
Most contractors right now have a backlog but they are concerned about what their operations are going to look like when they have completed the backlog. The obvious problem is that our expectations for the future have become a great deal more uncertain in the last few months than they were previously.
So how does a contractor make decisions about the size of its labor force and supervision in such an uncertain market environment?
Well, a great place to start is by understanding deeply how its project teams are really performing. We all know which projects make money and which don’t. But today we have tools that can tell a lot more of the story than that. In general, the contractors that effectively and efficiently manage the labor are those that can best adapt to fluid market conditions. So today we can use data to help contractors analyze their labor productivity at a much-deeper-than-surface level and to help them figure out how much capacity in their labor and supervision they really have.
Some of this just gets overlooked when a market environment is as strong as the one we have just come out of.
Information in hand, contractors are in a better position to respond to these market dynamics.
And similar discussions are taking place with respect to optimum levels of equipment and other fixed costs. In my experience, there is often a difference between the perceived use of assets—or what we instinctually think of how are assets and equipment are used—and the actual use when the data is analyzed.
So the key is that data can help us make decisions about what our labor force and supervision should look like, and what our fixed costs should look like to help us better manage our cash flows.
VITTARDI: Wick, what questions are you asking to make sure the ship is heading in the right direction?
ZIMMERMAN: Cash is always nearest and dearest to my heart, and it is the lifeblood really of every contractor. So the first question I ask myself is ‘What does my cash flow look like for the next 12 weeks? Six months? I look at both the short-term and long-term.
Profitability is equally important. That obviously impacts cash flow. Some of the questions I ask myself might be: Are my existing projects performing as efficiently as possible? Are we on budget? What is the revenue we will complete this year, and does it fall in line with the overhead structure that we have in place? What does my backlog look like, and does it support those revenue projections? And what happens to overall profitability and cash flow if some of my projects are delayed or canceled, which is certainly something that is likely to happen in this current economic climate.
And then do I need to reduce my overhead in turn? And if so when and by how much?
In uncertain times like we are experiencing today, it is important to look at the big picture and have the ability to run several what-if scenarios. For instance, if I know what my bid hit rate is for certain types of projects, various market segments, client types, etc., I can evaluate my backlog with that historical data to look at probable scenarios.
There are some tools that I like to use to do that – dashboards and so forth that make it easier to get access to that information quickly.
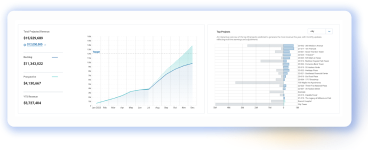
What you’re seeing now [SLIDE APPEARS, APP. 17 MIN. INTO VIDEO] is an example. What that could look like for you is anything you wanted to include.
We have used Foundation for a long, long time and so we are very familiar with it and able to create custom reports and mine information using Microsoft Query and Excel. So I know how to get what I need out of it, but it is still a manual and time-consuming effort to do that. Even to find the right table within Foundation for that information can be daunting.
A couple of years ago we started working with ProNovos, and now I have a financial dashboard that I can customize and use so that I can monitor cash flow, profitability, backlog and other KPIs that may be important to me at that particular time, and it is a huge benefit to be able to press a button and know the health of the business as opposed to spending hours gathering and manipulating data and trying to make sense of it.
The great part about it is, ProNovos pulls the data directly from Foundation and other software packages that we are using. It is a way to integrate all of that software into one front-end interface. There is no duplicate entry of information, and it is very convenient for everything from financial information to estimating information, CRM data, project management, whatever it is that you want to see.”
VITTARDI: John, from your research what question or questions do you think are key for contractors to kind of step back and examine?
KILLINGSWORTH: A practical application of analytics right now, considering the downturn and economic uncertainty is ‘how do we manage our overhead?’ We are all wanting to maintain a competitive balance between our overhead and revenue levels, but we also fear losing really good people. We know that if we let them go they will experience significant hardship, personally, and these are people that we care about, right?
But also knowing we have to stay profitable. We have to manage the business, and keep in mind, it is more expensive to get them back during the recovery. It is expensive to train new people.
So my research question that I have been working on is actually very closely related to what Bryce talked about and Wick just talked about. That is specifically looking at this basic question of ‘how do I manage my overhead—particularly the fixed personnel costs—in order to maintain a competitive balance in this industry?’
[KILLINGSWORTH SLIDES START AT 20:57]
This is what I call my ‘Pink Floyd graph’ with money and time. At a given point in time, we look at our revenue levels and hopefully this is the trend, right? That we’re headed in that positive direction. We all have variable costs, and those tend to track with revenue. They will increase proportionally with revenue, and so what is left over is our fixed costs. Those tend to stay constant within a range of revenue, right? It is relative.
And of course, then that little gap that is left over is our profits, and if we can increase revenues and maintain our fixed costs, then our profits will increase.
So let’s take an example – a typical construction company that is making $103 million in annual revenues.
Typical costs on the high end would be about 5.4 percent and variable costs are going to stay right around 92 percent, give or take. And so at this level our profits are 2.5 or 2.6 percent. These are industry averages here that I have been able to get from my research.
So as we move forward in time our fixed costs are staying constant at that $4.6 million, but now we are increasing our revenue. So now we are at $133 million, and variable costs are going to continue to track at the same rate. But you can see right now that our profits have increased because our fixed costs are constant.
Of course, we will get to a point where our fixed personnel costs specifically are getting strained, and we start to see indications of inefficiencies, and the research indicates that that point is right around 1.6 percent of total revenue. Again, you can see those fixed costs constant at $4.6 million. Again, this is just an example of an average company that is increasing its revenue.
We are maximizing our profits here, but we are also maximizing our efficiency of fixed costs. So there has to be a decision made: When are we going to make that step up in our fixed costs? As we do, of course, that eats into our profits, but if there is a continuing revenue trend forward, then we know we are making appropriate adjustment.
If we delay that process, of course, we are going to increase our profits significantly, but we are also going to see more turnover as we overload that personnel.
So in this scenario—where we are looking at the potential of the downturn and our trend in revenue might be headed downward—that is a big concern.
We are holding onto that fixed personnel or those fixed costs, right? And then we can see our profits will begin to tighten up.
So we have got to make a decision here: Do we hold onto all of those great people or do we down step? If we make the step down here, we could still observe some profit gains, but that means we are letting go of good people. So that is the strategy, the managerial sort of decision-making that we have got to make. You can delay that adjustment and hold onto those fixed personnel, but we also know that that is going to eat into our profits. We are going to experience loss in that case.
[PAUSE DUE TO TECH ISSUES AT SLIDE “Ratio of FPC/Rev as Revenue Grows,” 25:43]
VITTARDI: We did have a question pop up from one of our participants. If they know their fixed costs, is there a way to calculate what their annual revenue should be? I was thinking we could ask that while we are in-between slides, while we transition back to the PowerPoint here.
KILLINGSWORTH: The slide following this one has a formula to be able to calculate that. So I’m going to hold onto that because it is a great question, but I think we will get to it on the very next slide.
So let me build into that – [SLIDES RESUME AT 26:58]
So here is where our company was that we were looking at. They were in this range making $150 million give or take, right? And so this table tells you what the industry is doing in terms of its fixed personnel costs, and the average company that is doing $150 million—between $130 million and $160 million—is going to spend about 3.5 percent on average on fixed personnel costs.
Their upper limit, meaning right where it gets tight, they are going to observe some inefficiencies at this level–1.7 percent–and when you get to that you start experiencing burnout.
When you are on the lower limit, you are spending quite a bit more on fixed personnel and so they are not quite as busy, but that that lower limit is where you want to step into.
So that gives you an idea of where the industry is performing. The idea is that if you are in one of these categories—you have put yourself, in terms of revenue, in one of these categories—you can use this percentage to calculate where your competition basically is behaving between these ranges.
This is basically the same information, but you could see it graphically and here is our trend line: As companies grow in terms of their revenue size, we can see that they are spending less proportionately on fixed personnel. That doesn’t mean there are fewer dollars. It’s just that the percentage of that revenue is decreasing.
So using this really basic slope formula is how you can answer the question. If I know my fixed costs, Y, I can use this formula basically to calculate where I should be in terms of revenue in order to be competitive.
Or if you know what your projected revenue is, substitute that number for X and that will give you a good idea what your budget should be for your fixed costs. So you can use it either way in that managerial decision-making.
VITTARDI: Bruce I know you work with a number of construction executives on data strategy and analytical enablement, taking this information and utilizing it and so forth. You are talking through with them what are key questions that they need to be asking and so forth. You are in a really good position to ask that or at least share your perspective and shed some light on that.
ORR: Yeah, so I have been thinking about how to answer that, and that is a tough one. And, really, I think it all depends on the contractor’s individual situation right now. I am in a very unique situation of having the privilege of knowing the questions that construction companies are asking in this area.
A few weeks ago, it was all about the federal Paycheck Protection Program. When we looked at the top queries on our server, we saw complex questions related to headcount and paid wages.
And really that is not surprising, given the type of information that the government was requesting. However, I was surprised by the number of complex, what-if scenarios that were created. So I saw something like, for every one question such as ‘how much did we pay in wages from 2019 to Q1 of this year?’ there was an average of eight what-if scenarios.
It’s great that people are taking advantage of analytics. That really shows the power of analytics to add in those what-if scenarios when you have those types of questions to answer.
Another time-sensitive question that I am seeing relates to cash flow, profit protection and cash reserves. [SLIDE 32:10 IN VIDEO]
So for instance this graph has gained popularity recently because it identifies and tracks the causes of slow receivables, and it also calculates the financial burden to finance negative cash flows. The recent interest in information like this tells me that companies are trying to tighten things up and improve the speed at which their customers are paying invoices.
I am really excited to see the use of our platform during times like this.
But there are additional questions that will be increasingly important as we get closer to 2021. They will be more strategic in nature. It’s important to know what the demand outlook for your services will look like; what is driving that demand; and how you can anticipate these demands changing over time.
Really, strategic decisions ultimately are based on assumptions about how our new world will unfold.
To improve the chances for a successful outcome, these assumptions must be continuously monitored and tested while trying to implement them, and it is very difficult to do that without the right analytical tools. I truly believe that with time the questions will change and the level of complexity to answer those questions will change as well. Having strong analytics will keep most contractors above their competitors.
VITTARDI: Wick, how do you take the leap from information to action?
ZIMMERMAN: Years ago, we spent more time trying to find data, mine it, make sense of it and by the time we did all of that we were worn out and ready to give up. I think that is common in construction. Construction contractors are typically very old-school and slow to adapt to new technologies and thought processes and so forth.
From the early days of construction we have always known some metrics – how many yards of concrete should a crew pour in a day; what is the best ratio of field to office personnel and things of that sort—and we all look at historical data, always have, such as financial statements, WIP reports, all of that stuff.
Each of those is that part of being informed. But by its own nature being informed is a passive form. You have information, but you’re not using it to determine your future actions. Going the next step forward, taking informed actions, is taking all of that information that you have gathered over the years, sorting through it, identifying metrics, and trends and then using that information to predict future outcomes – that is taking informed action.
I encourage every contractor to take a plunge into the data. Really, you will be amazed at the information you have at your fingertips. It’s information that you already have but that you can now use to help make better decisions, faster. In economic times like we are in right now, you need to use every tool in your toolbox, especially the ones you didn’t even know you had. So embrace the data. Understand what it is telling you, take action, monitor the results, adjust course and repeat. In my mind, it is all about continuous improvement: As long as you can measure it, you can manage it.
VITTARDI: Information is critical when you’ve got to make decisions quickly. [AND ASKS PANEL TO CLARIFY DISTINCTION BETWEEN FIXED AND VARIABLE COSTS.]
KILLINGSWORTH: Fixed costs—generally speaking, that is your overhead. So all of your direct costs are variable costs and then you have got those indirect costs that are supervision of your projects and those kinds of things. Those tend to be more variable costs that will track with revenue; your fixed costs are usually associated with those costs that are not dependent on the project itself – the construction activity. So yes, your estimating department and your HR and your accounting department, all of that personnel for the most part is fixed.
And obviously the building that they work in and the desks that they sit at and all of those kinds of things are for the most part fixed. There is of course some variability in a little bit of that. If you hire an intern from CSU for instance, from the CM program, which I highly recommend [laughs], that is a variable cost to that overhead. You’re only going to do that when revenues are demanding it.
Obviously, overtime-related considerations, that’s a variable portion of that overhead, but for the most part your G&A is fixed.
WISAN: The accounting definition of a fixed cost is one that does not change with volume. So in addition to some of those that John mentioned, I would say that generally [includes] costs of ownership or leasing assets. So equipment ownership costs are definitely fixed costs but not the operating costs. Yard expenses, John talked about office staff and supervisory staff that are paid on a salary basis—those are the big ones that we typically see as fixed costs.
VITTARDI READS AUDIENCE QUESTION: For any company, is it easy to determine the volume of work which is optimum for each project manager to handle—assuming that the work intensity for each manager is different at different companies?
ZIMMERMAN: Is it easy? I don’t know that it is easy, but we certainly have created what we call capability models, not only for project management. We do the same thing for estimators. Some of it is obviously based on the level of experience. So we would expect a senior project manager to be able to manage more work than a junior project manager. But you can do that by looking back through the data that you have collected for each project manager: What volume of work have they managed throughout the years? You can look at profitability to see whether there comes a point where that volume increases to the level where you start to see some profit fade on the jobs.
And I know that in our business some of the big variables that are really hard to pinpoint exactly are: project managers are very busy at the beginning of the job and at the end of a job and then in the middle it kind of slows down a bit. So for us a $2 million job is probably an average job and so a senior project manager should be able to do maybe five of those a year, but if he had all five of them starting at the same time, that guy is going to be absolutely overwhelmed.
So there’s a little bit of common sense that you have to weigh into it as well. But you definitely can come up with dollar values for the capability of those folks. Let’s say you are doing your budgeting and planning. If you are growing the business and you are starting the conversation with a certain volume of revenue, then you need to know how many project managers you’re going to need to have to do that amount of revenue. Then you’ll need to know your hit rate as to how many jobs you are going to have to bid in order to get that volume of revenue. And then you need to know how many estimators you’ll need to bid that amount of work to get where you want to be. You’re right on track with that question.
VITTARDI READS AUDIENCE QUESTION: Some of the costs are both fixed and variable. For example, insurance that has a minimum premium. Do you break these two in the separate costs that you can Enter the fixed and variable portion separately?
WISAN: I love accounting questions. I think so. I think you need to. I will just say that the real benefit of understanding the difference between a fixed cost and a variable cost in terms of a contractor’s performance is that it helps you understand your true costs of performance. And invariably what I’ve seen in my career is that the more sophisticated a contractor becomes, the deeper their understanding of their true cost of operations. So I would argue that a contractor who is able to split the variable and fixed component of something like insurance and then be able to reflect that in their ongoing bids, estimates and then job costing is a contractor that is going to outperform over time, versus a contractor that lacks that level of sophistication. This doesn’t happen overnight but that is the long answer.
The short answer is: Absolutely it is to your benefit to understand and split the variable versus fixed components of any cost such as insurance.