
Empower all project stakeholders with clear financial visibility into a project’s profit margin to monitor fade or gain.

Projected Final Cost
A standardized way to update and track cost-to-completion across all projects.

Record the root causes for cost overruns and savings, leveraging these insights as valuable lessons for future project planning and execution.

Proactively identify potential cost overruns, enabling early intervention and corrective actions to prevent minor issues from escalating.
Projected Final Cost
A standardized way to update and track cost-to-completion across all projects.
Record the root causes for cost overruns and savings, leveraging these insights as valuable lessons for future project planning and execution.
Proactively identify potential cost overruns, enabling early intervention and corrective actions to prevent minor issues from escalating.

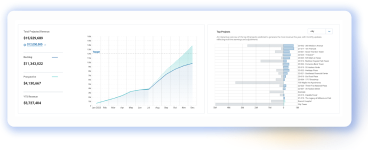
Job Costs Report
- Deliver a holistic grid that breaks down a project by phase, cost code, and cost class into the budget, job cost to date, percentage complete, and cost remaining for each line item to ensure projects finish on budget.
- See a bust report to identify what activities have cost overruns on a project to address the issue before the cost overrun grows immediately.
- Visualize costs by month and see a project’s cost curve to understand how a project is progressing to help make accurate cost projection forecasts.
Labor Analysis Dashboard
- See how actual hours are tracked against budgeted hours. Identify potential overruns and take corrective action before an activity goes over budget.
- Give your field personnel access to the labor hour budgets on a project to ensure they code time to the correct activity and the labor data is accurate.
- See a curve of hours spent on a project over time. Identify where disruptions occur to ensure you are compensated for any impacts on work performance.

“ProNovos’ advanced analytics and forecasting tools are industry-leading. The platform allows project managers to switch from intuitive to data-driven decision-making. They’ve worked closely with our project managers to reach a deep understanding of their pain points and requirements.”
Rick Bowers
CTO, Cardinal Civil Contracting