fbpx

Published May 4, 2021 . 0 min read

‘Your Data is Good Enough’: ProNovos on the Constructed Futures Podcast

‘Your Data is Good Enough’: ProNovos on the Constructed Futures Podcast

construction worker

Construction contractors already have the data they need to run their projects and businesses more efficiently.

That was the central theme of the April 26 episode of Hugh Seaton’s highly informative “Constructed Futures” podcast, a weekly conversation about the future of our built environment, featuring outside experts and seasoned leaders in construction, architecture and more.

The episode was titled “Real-World Uses of Data in Construction with ProNovos.” It featured Bruce Orr, Founder of Atlanta-based ProNovos and a 20-year veteran of data analytics, and J. Wickham “Wick” Zimmerman, CEO and Co-Founder of OTL, a design-build contracting firm known for its rock work, themed environments and specialty water feature projects for commercial properties all over the country.

Zimmerman has been a ProNovos customer for several years and has transformed OTL into a data-driven organization. What began with automated dashboards and reports based on OTL’s data from Foundation rapidly turned into advanced analytics.
Data Discovery in Construction

To start off the conversation, Seaton quizzed Orr and Zimmerman about how their respective companies work together. It all starts, Orr explained, with data discovery, which the data scientist described as “uncovering hidden trends that you typically cannot see just looking at columns and rows of numbers.”

A single job-cost report, for example, could contain hundreds of actual and estimated costs. Prior to working with ProNovos, Zimmerman spent a lot of time going back and forth between complex reports in OTL’s accounting, estimating and project-management software. In addition, he often needed to manually extract different datasets to put together his own analytical models, because most of OTL’s databases remained siloed, even though they all used the SQL Server language. “One of the great things about ProNovos is you can take all of that data and put it in one warehouse, so that you have a single interface to access all of your information,” Zimmerman explained. “That is a huge, huge thing for us on the operational side of this process.”

“One of the great things about ProNovos is you can take all of that data and put it in one warehouse, so that you have a single interface to access all of your information. That is a huge, huge thing for us on the operational side of this process.”

Construction Analytics Dashboards by Role

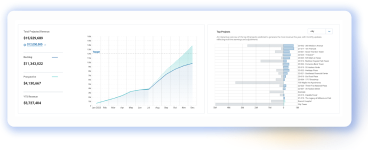
As an expert in construction financial management, Zimmerman uses ProNovos to stay informed about OTL’s projects, cash position and companywide profitability. “If I see something that is out of whack—such as projects trending over budget—I can drill down to see what’s going on there,” he said on the podcast. “It gives you a great visual for that.”

But other role-players at OTL benefit from access to different ProNovos data visualizations. “The operations guy can look at a different set of information, or admin accounting can look at a different dashboard,” Zimmerman explained. “Everybody can have their own dashboard based on what they find most important to their job.”

Predictive Analytics in Construction

Some of the more common uses of the ProNovos Construction Intelligence Cloud include tracking key data on bids, resources, equipment and schedules; connecting people, projects, schedules, tasks and apps in a single interface; and streamlining clunky approaches to reporting and data entry.

But on the podcast, Seaton was particularly interested in how ProNovos can be used to make predictions. Zimmerman provided some examples.  

 To predict where OTL is headed revenue-wise, for instance, the CEO applies analytics to basic processes such as the company’s funnel for business development. “For each part of that funnel, we want to look at how many touches does it take to get a lead, and how many leads does it take to get an opportunity, and how many opportunities does it take to get a job,” Zimmerman explained. Adding a third dimension—time—allows OTL to start making predictions. “Now you have an ability to look down and say, ‘OK, if I want to do X dollars in revenue, I need to bid this many jobs, which means I need this many leads and this many touches,’” the CEO explained.

This, in turn, leads to additional predictive calculations on the HR front—how many biz dev, estimating and project-management personnel OTL will need to generate those target revenues.

 “That planning and using that information is especially beneficial,” Zimmerman told Seaton. “It does allow us to predict our personnel and human resources needs down the road. In taking our labor budgets and the man hours that we have projected for certain periods of time, and then comparing that to the manpower we have available, are we going to be in a pinch?”

Nor does OTL, in its use of ProNovos, treat all personnel as mere numbers on a screen: The dashboards and scorecards take into account that some are good at plumbing or roofing, and others at plaster, painting or other specialties. It’s important for OTL “to have the right person, doing the right task, on the right job, at the right place,” the CEO explained, “because we work all over the world.”

Using Analytics to Reduce Attrition in Construction

Orr cited several other ways in which contractors use ProNovos to make better decisions. One ProNovos customer, he told Seaton, used analytics to overcome a stumbling block on the construction of a major music venue in a market that was outside its usual sphere of operations.

On the multiyear project, the contractor was continually losing construction personnel to its competitors. After using ProNovos to crunch some numbers, Orr pointed out to the contractor that it was paying $30 an hour—the rate in its home market—in an area of the country where $35 was the norm. “You are losing people on this job because you are underpaying them,” Orr recounted telling the contractor. “If you increase your pay by $5 dollars, your attrition rate will get better.”

Noting that attrition is “always an issue,” Seaton described this use of analytics as a “huge point.”

 Zimmerman cited another example in which Orr provided some predictions related to job costs. “Bruce did that exercise, and his projection was within 5 percent of the actual job cost for that period,” the CEO said. “It was absolutely amazing. It just goes to show that using this historical information and having the ability to compute that and project that forward is incredibly powerful.” 

The full podcast is available here.

SEE WHAT PRONOVOS CAN DO FOR YOUR ORGANIZATION