Published October 1, 2019 . 0 min read
Achieving a Balanced Backlog via Construction Data Analytics
Business
Achieving a Balanced Backlog in Construction—3 KPIs

Construction CEOs tend to spend a lot of time thinking about one question in particular: “What is the ideal blend of jobs in the pipeline to ensure optimal growth for the company, in good times and bad?”
The President of a large Washington-based General Contractor sums up the dilemma nicely. “Human nature can cloud your judgment when a known opportunity is present and tangible. It can be difficult to wait for another opportunity, finding that best mix that yields the optimum gross margin for the company.”
Finding that best mix—in other words, achieving a balanced backlog—can influence your strategy and bolster your odds of success.
Finding the Best Mix

Most organizations have historical datasets that illuminate the circumstances that have yielded higher profits for them. These can include jobs that fell into certain contract-value groupings, or jobs that took place in specific markets. They can also be situations that hinge on particular project types, such as tenant improvements.
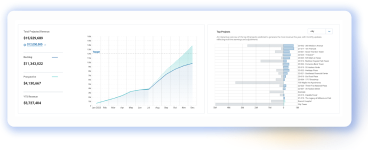
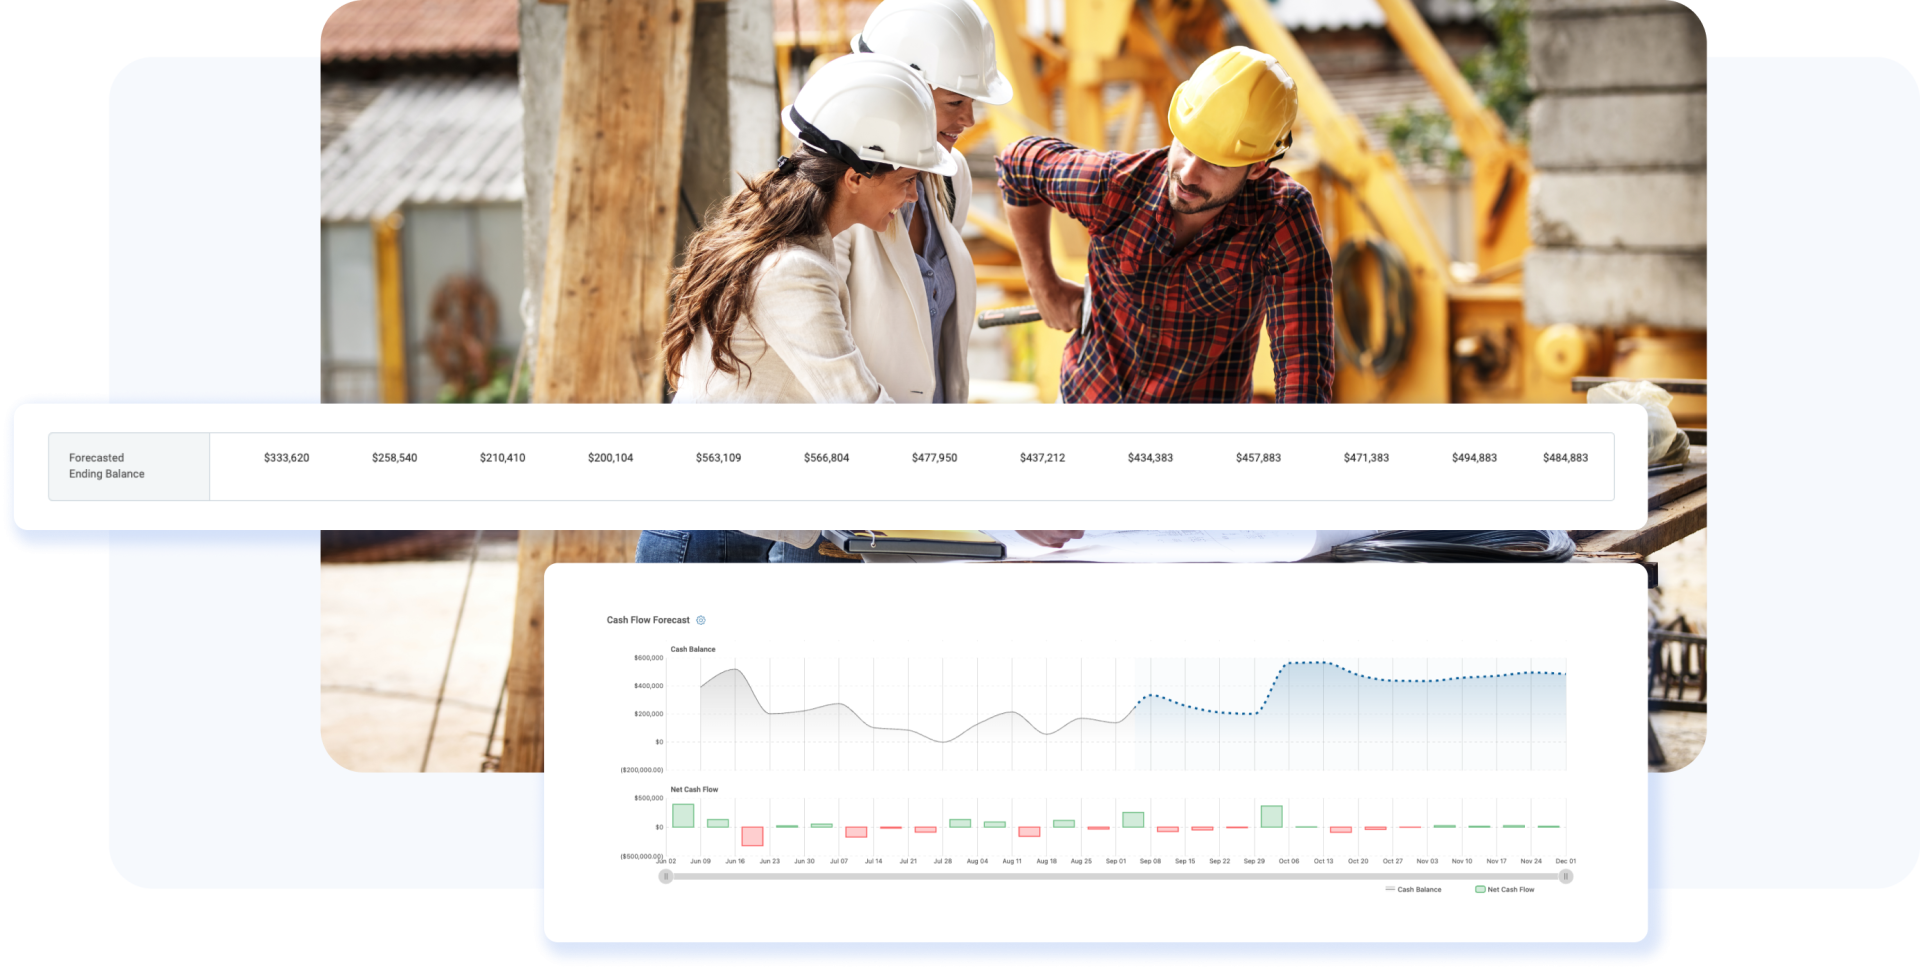
Many contractors never leverage the full value of this data to understand their business performance. However, by analyzing this information properly across just a few commonly used Key Performance Indicators or KPIs, they can uncover invaluable insights. This type of business intelligence can give them a competitive edge.
Balanced Backlogs
When it comes to balanced backlogs, consider three important KPIs:
- Annual revenue
- Annual gross profit percentage
- Monthly return on scarce resources.
The relationship between these three is the foundation of financial balance within the organization. That’s why it is so important to set realistic targets for each of these KPIs.

There are many ways to set realistic targets for the balanced backlog KPIs. You can do this in multiple ways. However, be aware of using a linear target model in Excel, (e.g. a 10% increase of last year’s revenue). Most construction data analytics platforms give you the ability to take a higher-resolution approach. For example, a logistical model that incorporates nonlinear functions.

Using Insights
The next step is to use the insights from that modeling to find the right mix of jobs for your pipeline. In most cases, it is as simple as taking the three aforementioned KPIs and measuring them across the following job attributes:
- Contract Value Groupings — we recommend segmenting into groups of 10
- Market — e.g. residential, healthcare, retail, etc.
- Project Duration
- Hours by Scarce Resource
You can do this in Excel or have prebuilt dashboards that include this functionality.
If you’re interested in a free balanced backlog analysis using your data, click below and an expert from ProNovos Construction Data Analytics will be in touch.
AUTHOR: BRUCE ORR
Bruce Orr is the Chief Data Scientist at ProNovos Construction Analytics. ProNovos provides affordable analytical solutions for contracting firms that utilize ERP software from Sage, Viewpoint, Procore, Foundation, SAP, Jonas, Accubuild and many others.
ADDITIONAL RESOURCES:
Construction resource management capabilities of ProNovos’ Operations Manager construction software
Case study of McClone Construction Co.’s use of Operations Manager for construction resource management
Press release on the launch of Operations Manager–a good primer on the benefits of construction resource management and construction software platforms


