fbpx

Published June 28, 2023 . 5 mins read

10 questions you can get answered about your financial performance

Managing a construction business involves juggling numerous moving parts, from pre-construction to closeout. To streamline collaboration between the field and office and allow executives to focus on the big picture, it’s crucial to ensure that the entire business is equipped with timely and accurate data on financial performance.

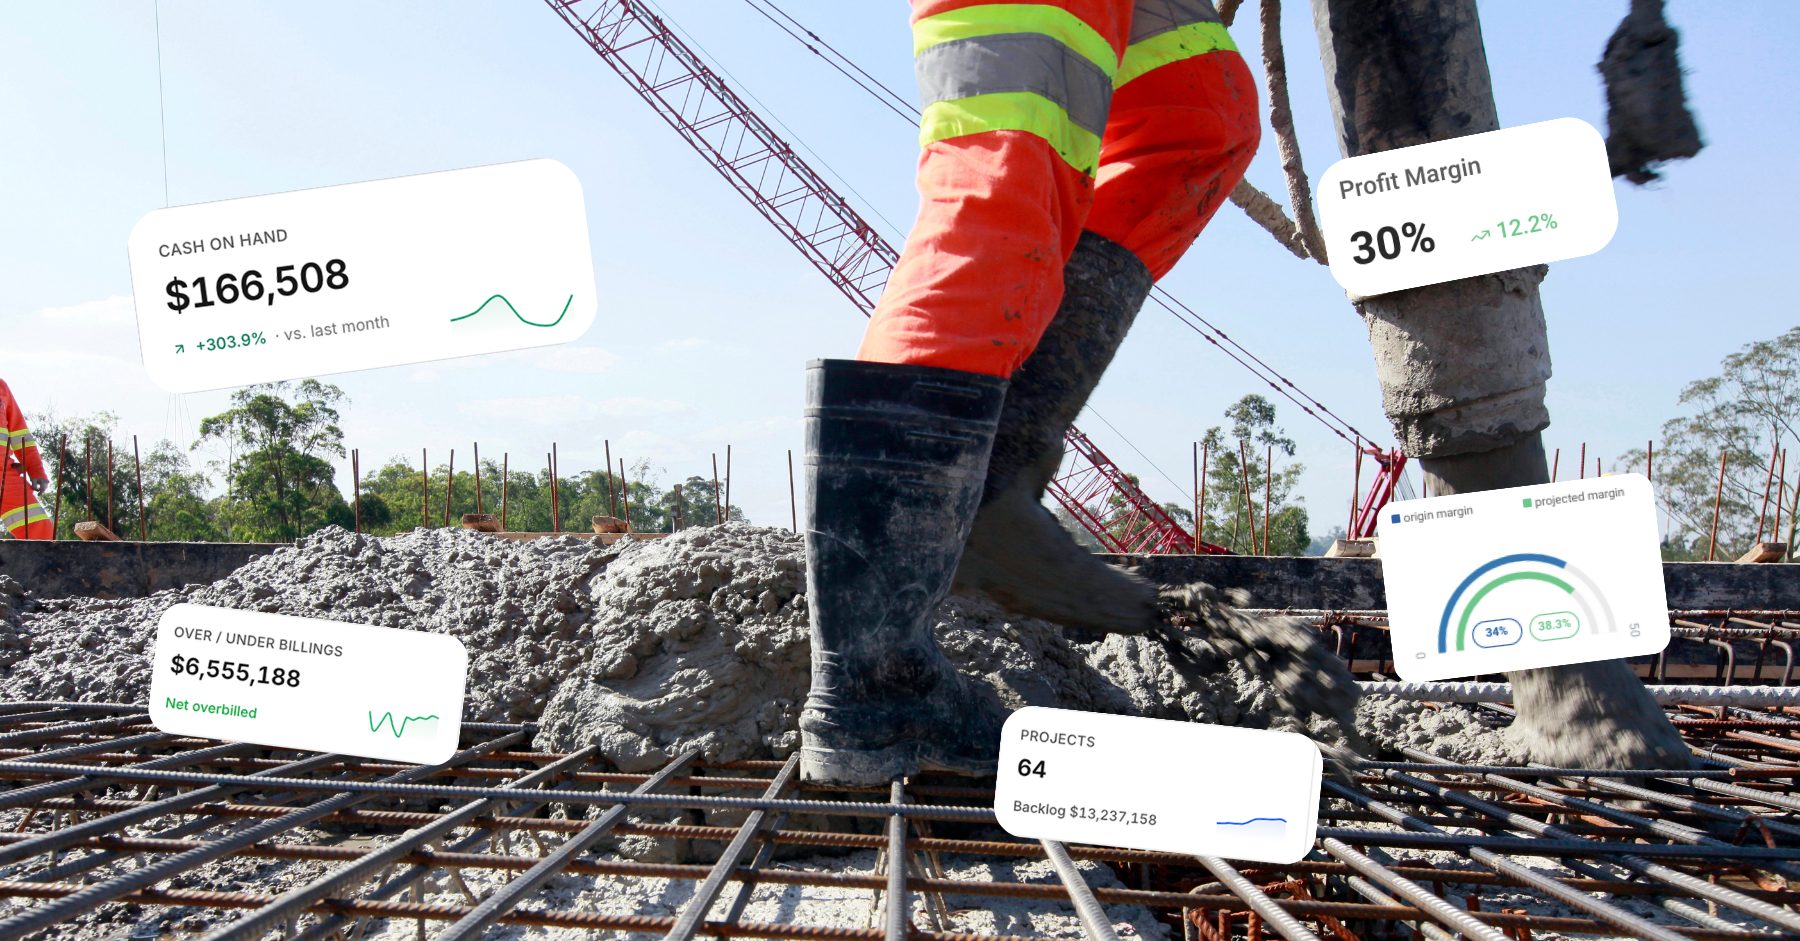
While having access to data is essential, understanding and making sense of that data is equally important. This is where pre-built dashboards and automated financial workflows come into play. These dashboards empower users with rapid analysis of company and project performance. They spotlight crucial KPIs, offering valuable insights to safeguard profit margins and optimize cash flow, facilitating informed decision-making.

In our analytics marketplace, we offer dashboards that instantly answer key questions, such as:

1. Where and what is the source of under-billings?

Multiple dashboards in the analytics marketplace can help you quickly identify the source of under-billings and better maintain cash flow and profitability. With easy-to-use filters and intuitive visualizations, you can quickly drill down into the data to identify specific areas that may be causing under-billings.

Analytics Marketplace

2. How will this approved or pending change order impact the profit margin on my project?

Change orders can have a significant impact on the profitability of a project, and understanding that impact is crucial to making informed decisions. With the help of the Company Change Order Report, you can quickly analyze the financial impact of a change order and make adjustments to protect your profit margin.

3. What was the top reason for cost adjustments on the project?

Understanding the root cause of cost adjustments is critical to improving your processes and minimizing future adjustments. With the help of data visualizations and advanced filtering options, you can quickly identify patterns and trends in your cost data to help you make data-driven decisions.

4. Are any job costs activities at risk of having a cost overrun?

The real-time Job Costs Report identifies which activities have cost overruns on a particular project. By regularly generating and analyzing these reports, users can take immediate action to eliminate budget-busters before they get out of hand.

5. Where is the profit margin on my project today?

Dashboards in the analytics marketplace can provide real-time data on the financial health of your projects, including the profit margin. Giving the project team and stakeholders the ability to view data at a high level or drill down into specific details, they can quickly identify areas of concern and take action to protect profitability.

Projected Final Costs with root cause analysis

6. How has the profit margin changed during the project?

Understanding how your profit margin has changed over time is crucial to identify potential issues early on. With the Project Dashboard, you can view profit margin trends and identify areas where you may need to make adjustments to protect your profitability.

7. How have the Days Sales Outstanding been trending?

Monitoring Days Sales Outstanding (DSO) can help you identify potential cash flow issues before they become major problems. With the help of analytics dashboards, you can view your DSO trend over time and identify areas where you may need to make adjustments to improve your cash position.

8. Who’s your top customer?

Use your existing customer data to identify which clients are most valuable to your business. The Customer Analysis dashboard provides insights into customer behavior, such as payment history and trends, that can help you make informed decisions about resource allocation and customer relationship strategies.

9. What is the current percentage complete and profitability of our active projects?

Make informed decisions about resource allocation and project management. Analytics dashboards can automate real-time data on the financial health of your projects, allowing you to understand where each project stands and protect your profitability.

10. What is our current cash balance and how has it changed this month?

Monitoring your cash flow more efficiently, and in real time. The Executive Dashboard in the analytics marketplace provides data on your cash position, allowing you to make informed decisions about spending and investment.

Our pre-built dashboards give you a deeper understanding of your financial data, enabling more informed decision-making for your construction business. Additionally, our dashboards offer robust data governance, allowing users to control information access based on roles and permissions, ensuring that each individual sees only the information that they need to see.