
ProNovos Unveils Powerful New Analytics Dashboards
Published September 28, 2020 . 0 min read
‘Love Your Data!’ ProNovos Unveils Powerful New Analytics Dashboards
Business
Love Your Data!

At ProNovos, we thrive on those “love-your-data moments.”
They usually go like this: Having explored one of our construction data analytics dashboards for the first time, a contractor smiles, looks up and says something like, “Oh, that’s cool. I’ve never seen it that way before. I love it!”
In an instant, that CFO or accounting manager has glimpsed how analytics and data visualization can yield new insights into people, projects and operations. They’ve seen how to turn an obstacle—an unwieldy, mushrooming volume of financial or operational data—into a powerful resource for making informed decisions now, from the jobsite to the boardroom.
In other words, they finally get us. 🙂
The magic of Love Your Data moments is the inspiration behind our latest initiative—a suite of new dashboards designed to take construction data visualization to the next level.
Loving Your Construction Data
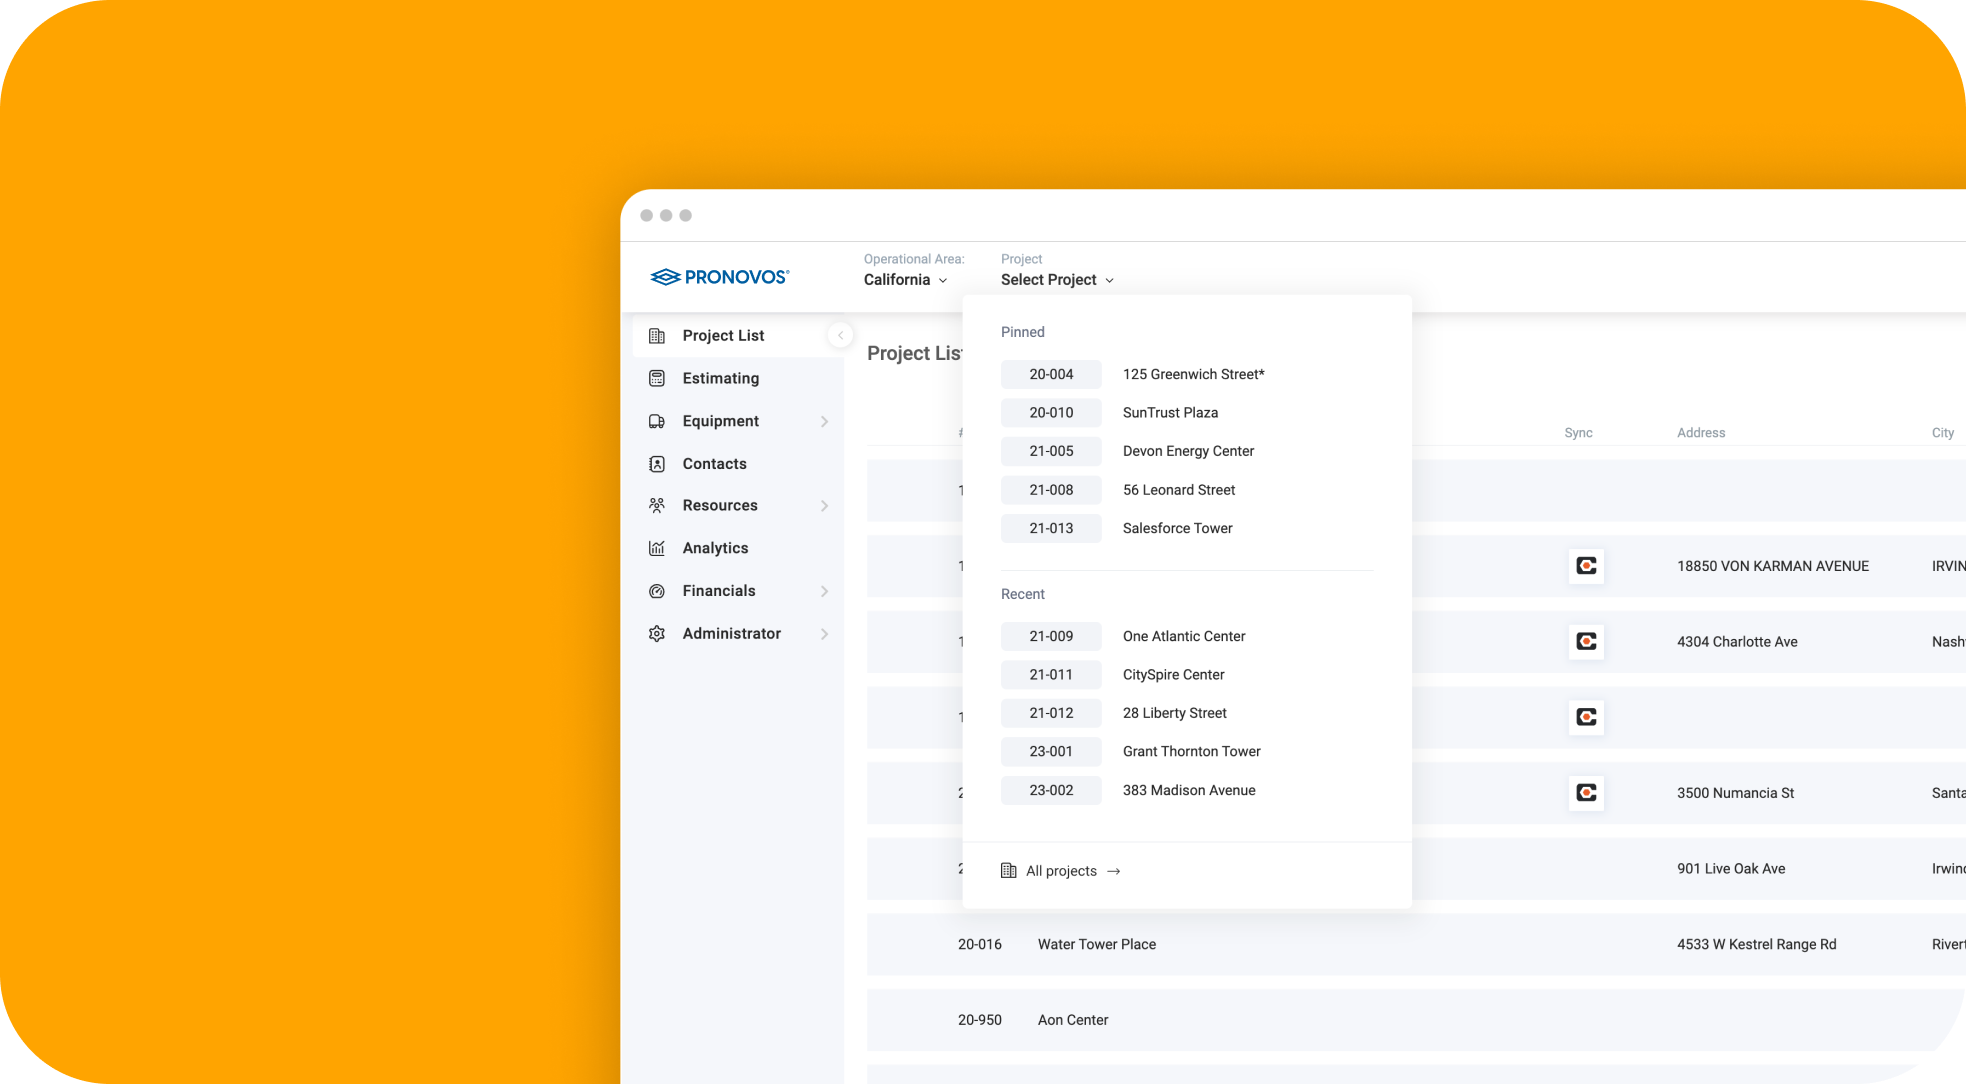
ProNovos integrates with Foundation, Viewpoint, Sage, Procore and many other applications to ramp up reporting efficiency in construction. We’re continually improving these analytical tools in close coordination with contractors from across the country.
Over the past few months, our development, design and data-science teams have been brainstorming on some useful new approaches to analysis, with a focus on visual storytelling for different roles at the company. The goal was to help ProNovos users get the most out of their key performance indicators (KPIs) by making full use of the power of data visualization.
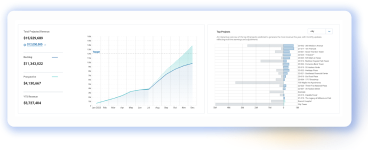
Our new Accounts Receivable dashboard is just one example of these reimagined reporting tools. We’ve just started rolling them out to existing users and demo’ing them for prospective customers. We’ll be spotlighting additional reports in the weeks to come.)

Reimagining Accounts Receivable Data in Construction
By integrating data streams from Foundation, Procore, Microsoft Excel and other programs into an analytics dashboard, construction contractors can save time and effort by reducing or eliminating the need to manually create and recreate complex reports.
Another compelling reason to embrace data science is the way it empowers you to advance your broader strategic goals.
Our new AR dashboard, for example, was carefully designed to help contractors ensure that their invoices are paid as quickly as possible.
When we showed it to Dr. John Killingsworth, a construction management professor at Colorado State University, he summarized the benefits of having data-driven windows into collection days, receipt-processing rates, customer-specific aging metrics and more.
“I love what you’ve been able to accomplish here,” said the professor, who frequently advises contractors on efficient approaches to financial management. “You’re taking that lengthy AR report and boiling it down into a quick visual that gives them their priorities for today.”
Construction Data Visualization: Customer-Specific AR Aging
To get a sense of how data visualization can help, take a look at our customer-specific AR aging graph in the lower left of our new AR report. The length and thickness of the horizontal lines gives accountants, c-suite executives and—importantly—project managers an easy way to see which customers owe the most money.
Color codes show the aging of those outstanding dollars, from the harmless 30-day demarcation to the much-more-concerning 90 days and counting.
ProNovos users can easily manipulate the report to prioritize the rankings: A contractor with a big cash-flow problem may want to focus primarily on collecting from those customers who owe the most; those with better cash positions could ask PMs to focus on customers that are chronically late.
A journaling feature allows PMs and other stakeholders to make notations about the collections actions they’ve taken or customer-specific considerations such as, “This is our German supplier; they always take 60 days or more to pay.”
Our report also allows AR departments to send field personnel easy-to-understand charts and graphs that help them prioritize their collections calls.
“What you have here is a really effective communication and prioritization tool,” Killingsworth said. “It also creates a high level of accountability. Let’s say you’re sitting in a meeting with all of the PMs. The VP of operations can pull up this AR report, point to that late, high-dollar-amount customer and say to the PM, ‘We have a cash-flow problem at this company. Talk to me about how we’re going to fix it.’”
Gaining Insights into Internal AR Bottlenecks
Other AR graphs in our new report help contactors better understand the overall state of their collections—including how internal bottlenecks may be acting as a drag on efficiency.
In the upper-right corner, our Collection Efficiency/Receipts Processed section provides benchmark averages to help AR decision-makers determine when their teams are processing receipts at the highest rate, right down to specific days of the week. “I really like it,” Killingsworth commented. “It reminds me of planning a visit to the gym. Why not do it during those hours when the place isn’t as busy? This gives contractors a way to more efficiently allocate their AR personnel.”
Broadly speaking, our vision for this section was to help contractors reduce their average collection days by giving them leading and lagging indicators.
“Let’s say I process more receipts this week than usual,” Killingsworth said. “The correlation should be that the figure for average collection days goes down. If you see that, then you really have isolated a variable that is influencing your collection efficiency. You can put that kind of information to good use.”
At ProNovos, we want our customers to learn to do amazing things with their data. Stay tuned for more details on how our new dashboards accomplish that goal. If you’d like to see a demo, just fill out our request form.
We’re happy to connect—and share a few love-your-data moments.
ADDITIONAL RESOURCES:
Construction resource management capabilities of ProNovos’ Operations Manager construction software
Case study of McClone Construction Co.’s use of Operations Manager for construction resource management
Press release on the launch of Operations Manager–a good primer on the benefits of construction resource management and construction software platforms